
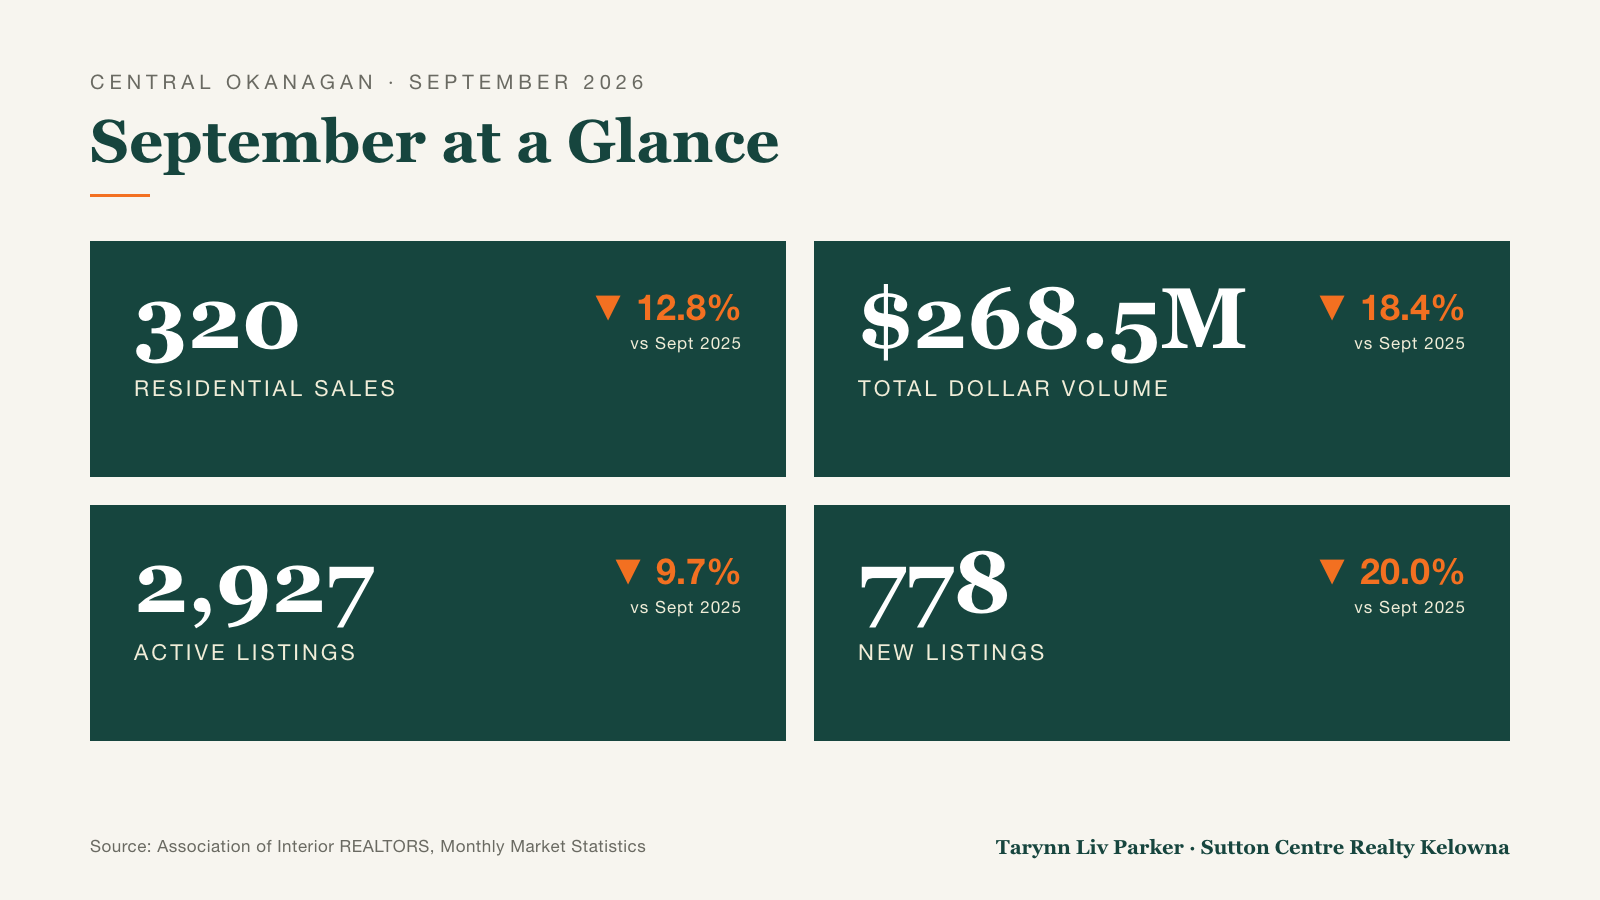
September brought 320 residential sales to the Central Okanagan, down from 367 in September of last year. That is a drop of 12.8%, and total dollar volume followed it down 18.4% to $268.5 million.
On the surface it reads like a slow month. Underneath, it was a quiet, steady one, and the details by home type tell a more useful story.
The September Numbers
Sales and supply
There were 2,927 active listings at the end of the month, 9.7% fewer than a year ago. New listings fell harder: 778 homes came to market, 20.0% fewer than last September.
Fewer people sold and fewer people listed. When both sides step back at once, prices tend to hold where they are rather than swing, which is mostly what we saw.
By Property Type
Single-family homes
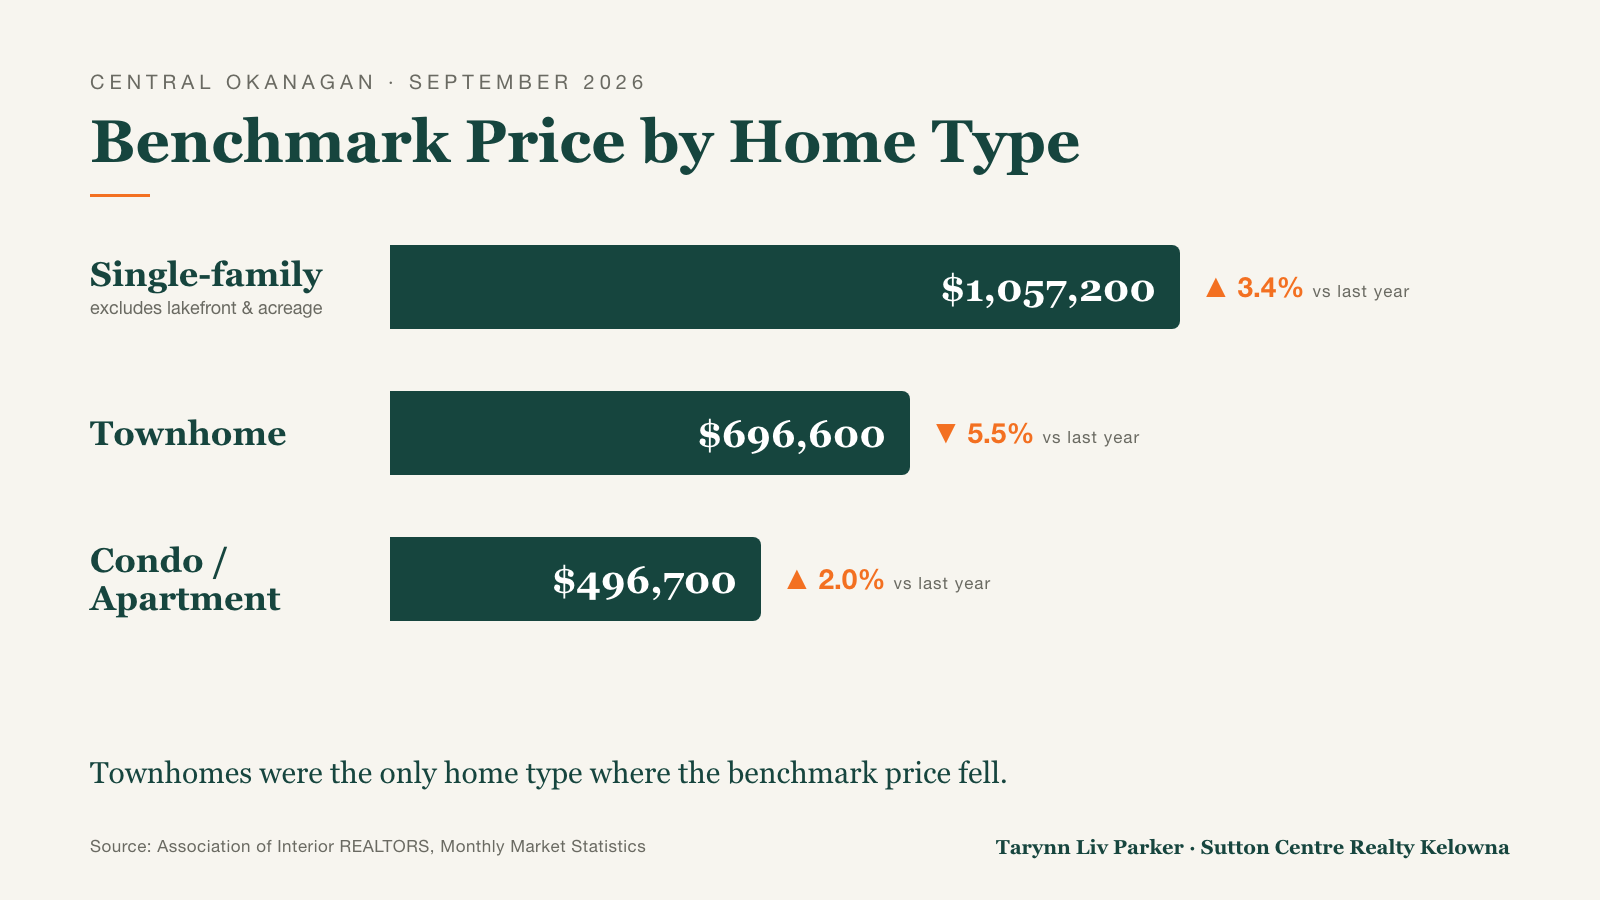
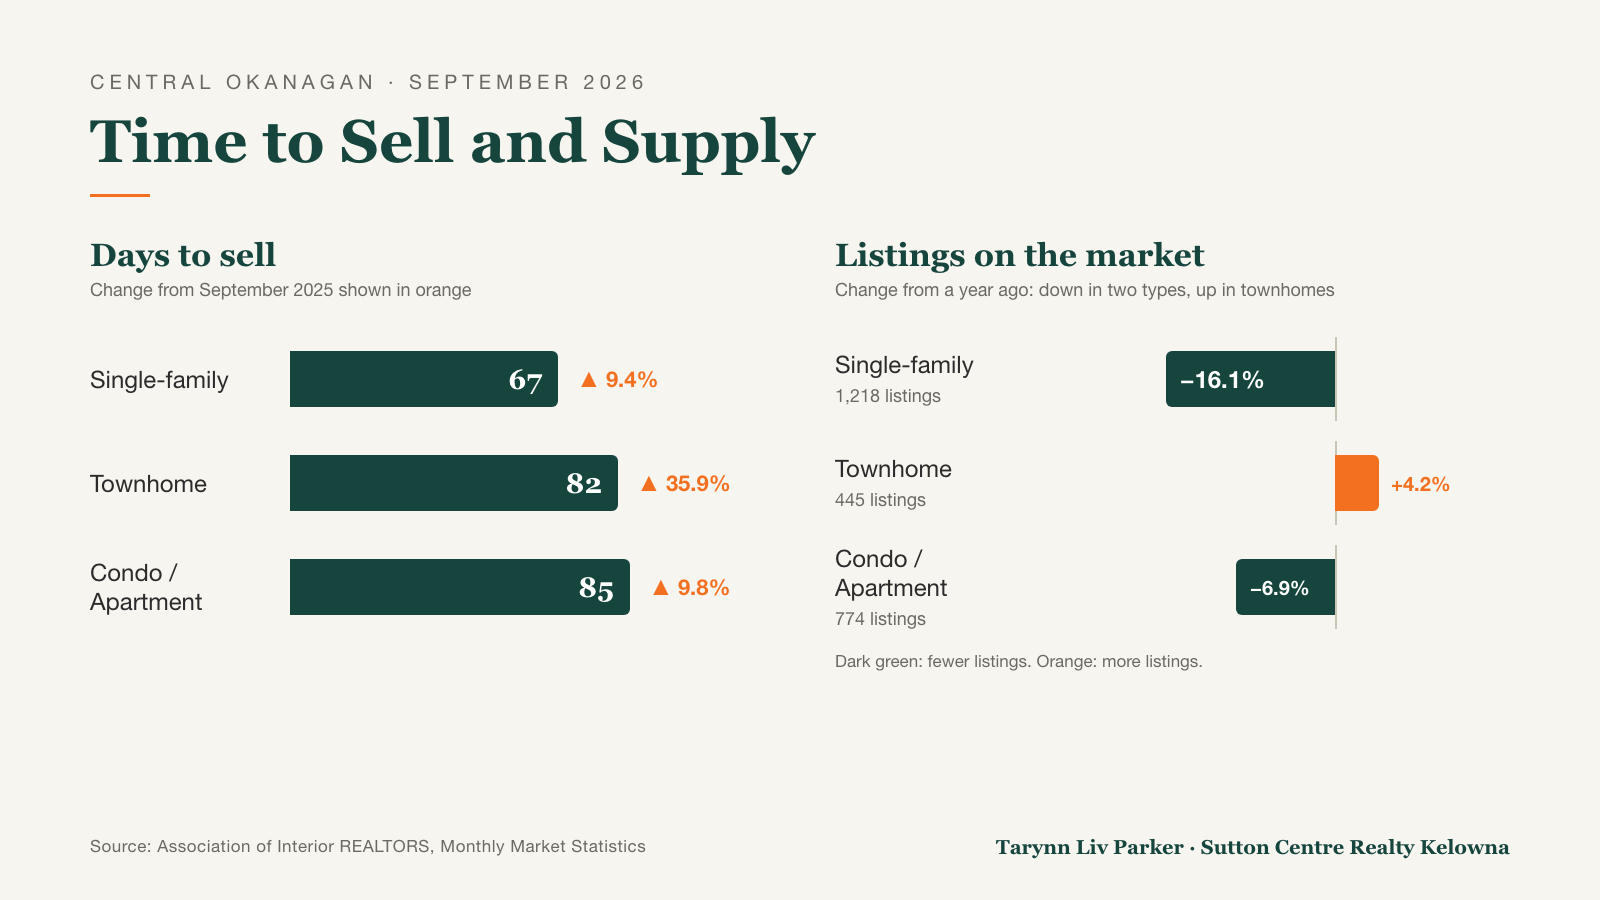
Single-family sales came in at 149, down 5.1%. The benchmark price was $1,057,200, up 3.4% from last year. Homes took 67 days to sell, up 9.4%, and inventory dropped 16.1% to 1,218 listings.
This is the steadiest part of the market. Less supply, a slightly longer wait, prices edging up.
Townhomes
Townhome sales were 46, down 14.8%. The benchmark price was $696,600, down 5.5%. Homes took 82 days to sell, 35.9% longer than a year ago, and inventory rose 4.2% to 445 listings.
Townhomes were the soft spot in September, and the only property type where supply grew. If you are buying one, you have more room to negotiate than you have had in a while.
Condos and apartments
Condo and apartment sales were 83, down 18.6%. The benchmark price was $496,700, up 2.0%. Homes took 85 days to sell, up 9.8%, and inventory fell 6.9% to 774 listings.
Fewer sales, but a benchmark price that moved up rather than down.
What the Association Is Seeing
The Association of Interior REALTORS describes early signs of a soft rebound after a challenging few months. Its president noted that inventory is not piling up, which is keeping conditions balanced, and that well-priced homes are being picked up relatively quickly.
That matches what I see on the ground. Homes priced for today's market and shown well still move. Homes priced for last year's hopes sit.
The Rate Backdrop
The Bank of Canada held its policy rate at 2.25% on September 2. Its next announcement is October 28.
Nationally, the Canadian Real Estate Association reported that August home sales slipped 0.7% from July, with 4.8 months of inventory across the country. That is close to the long-term average, which fits the balanced picture we are seeing here.
What This Means for You
If you are selling
Pricing carries more weight than ever. With fewer competing listings in single-family and condos, a well-priced, well-prepared home still gets attention. The time to price it right is before it hits the market, not after the first month of showings.
If you are buying
Townhomes offer the most room to negotiate. Condo buyers have fewer choices than a year ago, so if a home fits, it is worth moving on.
If your life has changed, your home can too
When the children are grown, the stairs feel steeper, or the garden asks more of your weekends than you want to give, it may be time for a home that suits the life you are living now. Somewhere easier, brighter and closer to the things you love, with more time left over to enjoy them. Many of the finished new homes across the Central Okanagan come with builder incentives, and I send a short monthly list of them. You can see the latest on my New Homes in The Okanagan page.
That kind of move has a name: rightsizing. It simply means choosing a home that fits this chapter of your life, and you can read how it works on my Rightsizing page.
Want Your Neighbourhood's Numbers?
Averages hide a lot. Lower Mission, Glenmore, Lake Country and West Kelowna can each tell a different story in the same month. Send me a message, call me at 250-215-4076, or book a coffee chat, and I will pull the numbers for your street, your building or the area you are watching.
Tarynn
Statistics are from the Association of Interior REALTORS Monthly Market Statistics for September 2026, compared with September 2025. Benchmark prices exclude lakefront and acreage single-family homes. National figures are from the Canadian Real Estate Association. This post is for information only and is not financial or real estate advice. Talk to me about your own situation before you decide.